The Power, Privilege, and the Purse Project
The Power, Privilege and the Purse project was a project that spanned both disciplines of Math and Humanities. This project talked of hot topics in the world around us that the public needs awareness of. In Math, we discussed the data behind these issues, and what we can do to represent the data. We also talked about personal finance to put us in the shoes of those in different economic brackets. When talking about personal finance, we first made a financial plan based off of a job we were planning on pursuing. This financial plan included a three bucket spending plan, as well as tax deductions and lifestyle costs. Then, we were asked what we thought minimum wage was and were assigned an amount of kids. Based off that, we had to make another financial plan. In terms of the statistical analysis of issues around us, we used statistics concepts to create graphs, and use those graphs in infographics. These statistics concepts included z-score, standard deviation, and graphical analysis.
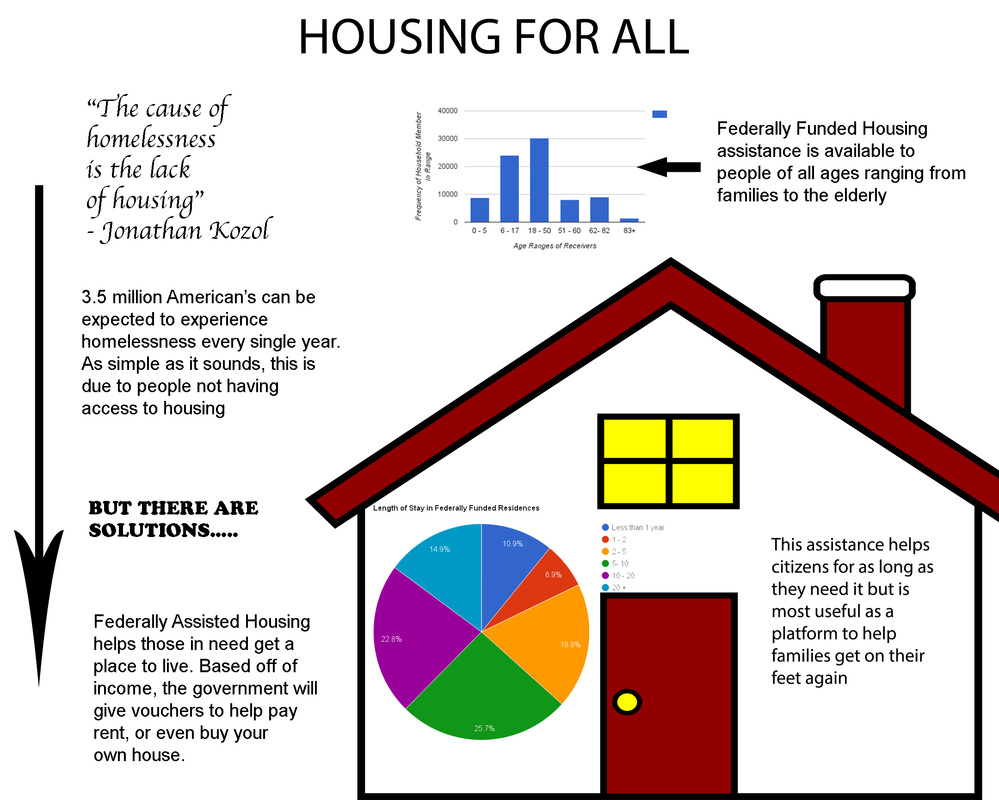
In order to do my financial plan, I was able to choose the job of a Software Engineer. Luckily for my financial plan, the starting salary of a Software Engineer is relatively high compared to other jobs. This created some flexibility when creating my budget. On the other hand, when we were given a minimum wage job with a set of kids, I was chosen to have 6 kids on an $8 an hour job. It was extremely difficult trying to balance my budget on that low of a salary so I took advantage of all the public services I could find to help me. When moving onto the statistics portion of the project, I found that learning the topics were quite simple even though I missed a day or two of school. Also, all of the practice Mrs. GC gave us making graphs helped when we went on to make our infographic. In fact, I found that my information was represented very well on graphical representation. When creating my infographic, I ran into the problem of which program I was going to use to make my infographic. After trying the website Mrs. GC suggested and looking around the internet, I decided on using photoshop because it would allow me to integrate the graphs into pictures off the internet. The part of the project that I enjoyed the most was actually learning the subjects in statistics used to make the graphs. A lot of these topics (z-score, standard deviation) I was not extremely familiar in, and it was fun to learn them. Here is a picture of the final draft of my infographic:
In order to do my financial plan, I was able to choose the job of a Software Engineer. Luckily for my financial plan, the starting salary of a Software Engineer is relatively high compared to other jobs. This created some flexibility when creating my budget. On the other hand, when we were given a minimum wage job with a set of kids, I was chosen to have 6 kids on an $8 an hour job. It was extremely difficult trying to balance my budget on that low of a salary so I took advantage of all the public services I could find to help me. When moving onto the statistics portion of the project, I found that learning the topics were quite simple even though I missed a day or two of school. Also, all of the practice Mrs. GC gave us making graphs helped when we went on to make our infographic. In fact, I found that my information was represented very well on graphical representation. When creating my infographic, I ran into the problem of which program I was going to use to make my infographic. After trying the website Mrs. GC suggested and looking around the internet, I decided on using photoshop because it would allow me to integrate the graphs into pictures off the internet. The part of the project that I enjoyed the most was actually learning the subjects in statistics used to make the graphs. A lot of these topics (z-score, standard deviation) I was not extremely familiar in, and it was fun to learn them. Here is a picture of the final draft of my infographic:
From this project, I learned a lot about putting myself in others shoes in regards to financial situations. I would say I understand the reasoning behind federally funded programs a little better after research. I also learned of the different kind of investments and their risk vs return. All of this information will be very useful in my own savings. I could use mathematical modeling to look at concrete numbers to see what I can afford and what I could not.
When learning about exponential growth and decay, it is easy to see the large effect that a change in the x axis can have in the y direction. This explains how some people can go under on their loans so quickly. Also, I noticed the effect that a small percentage change can have in the long run.
Coming into this project I had a basic understanding of logarithms and their laws, so what we learned served as a very handy review to help my comprehension of the problems. Logarithms are a useful tool when solving exponential problems(due to their inverse qualities).
The Statistical Problem Solving Process involves a 4 step process that is handy when followed. The steps are:
- Plan
- Collect
- Process
- Discuss/Share
This process I used in creating my graphs and turning them into my infographic. The planning process tied into the creation of my position paper for humanities. After collecting data from the HUD website, I processed it into the graphs, and shared it via my infographic.
The overview of statistical concepts, vocabulary and measurement we learned in this project seem to be very related to the comparison of data no matter the scale. Some of the concepts that were learned are Standard Deviation(Sample vs Population), z-score and correlation.
I used what I learned to understand the societal issues by taking a rational look at the problems we have around us. As well as presenting the problem, numbers often offer a look at what needs to be changed. This can be found through correlation, or other comparative measures. Overall, I feel as if I understand many different perspectives now that we completed this project.
After completing this project, we participated in a Symposium called "Mind the Gap". In this symposium, I was a panelist sharing my opinion on Women in the Workplace. I was able to form my opinion in this panel by looking at many different graphs, and using the skills learned in math to interpret them. During the panel, our group had a very good discussion regarding where the problem is and possible solutions to the different problems.
